Ecological Artificial Life - contents
I chose to develop my model in Visual Basic .NET 2003. One advantage of this is that I have been using various versions of Visual Basic for ten years, and I am now familiar with it, so I have been able to focus on the specific issues of this simulation, rather than spending time on general language issues.
VB.NET is conceptually similar to Java. The source code is compiled into MSIL (Microsoft Intermediate Language), which corresponds to Java bytecode. This is then translated into assembly language by the .NET runtime, which corresponds to the Java runtime environment. In order to create a VB.NET application, you need to have the .NET SDK installed on your machine. Like the Java SDK, this is a free download. You can then create and modify source code (plain text) files using the editor of your choice, and compile them from the command line. Alternately, you can use Visual Studio (as I have done), although this requires purchase. The implication of this is that someone else could modify the application I've developed here without needing to purchase any additional software.
In order to run the application, a user will require a computer with the .NET v1.1 framework installed. (Service Pack 1 for the framework is recommended, but not essential.) In practical terms, that means a PC running a recent version of Windows. There aren't any specific hardware requirements, although my development machine has a 2.8 Ghz CPU with 1 Gb of RAM, so any machine with an equal or better specification will have no trouble running the simulation. The client machine also needs to have a screen resolution of at least 1280 x 1024.
Although the .NET framework is only available for Windows, the Mono project (http://www.go-mono.com/) have developed an open-source equivalent for other platforms such as Linux. Microsoft also released a Free BSD version as a proof of concept, although this is not supported. I haven't tested my application with these alternatives, so I can't guarantee that it will work, but they do provide some measure of platform-independence.
At present I store video in a proprietary format, which can only be used by my application. I store the location of various objects (bees/food sources/hives), and then use the same logic as the main simulation to display those objects, rather than storing the actual colours and shapes. This makes the video faster to process, and ensures consistent results. I have investigated the possibility of generating a Windows Media file (with a .asf suffix), using the DirectShow library of DirectX. The resulting video could then be played back independently of my application, and could also be converted into other standard formats such as DivX. However, this library is not currently supported by Visual Basic .NET, since it is unmanaged code, and would require me to rewrite the application in Visual C++. It would also create an additional dependency for my application, and would reduce the likelihood of it being able to run on non-Windows platforms. There may be a managed version of this library available in the future, at which point I can re-evaluate this decision.
The naïve algorithm would be to take each bee and compare it to every other bee, seeing whether they are overlapping. However, this has a time complexity of O(n2), which is unacceptable. When there are 40,000 bees, doing two nested loops takes 2 seconds on my development machine. That doesn't include the actual overlap test itself, and it would be impractical to do this on every tick, since it involves too much overhead.
The solution I've used is to divide the bees into smaller groups. The first split is between the bees that are in a hive and those that are outside in the main dome area.
I am only treating the main dome area as a (horizontal) 2-dimensional plane, rather than a 3-dimensional space. So, effectively the bees are flying along at ground level. This can be justified by Von Frisch's experiments into dance language, as reported by Gould [1,p62], where he proved that bees don't track elevation. If two bees occupy the same space outside a hive, then I am ignoring this, on the basis that in real-life one could fly above the other. However, there are still cases where bees need to be aware of each other, such as when swarming and mating (when there is a "cloud" of bees). In a situation like this, the dome could be divided into rectangles to improve efficiency further, so that only bees in the same rectangle would be eligible for comparison. Generally, however, only a small proportion of a hive's population is outside at any one time, so there aren't many comparisons to make.
Inside a hive, each comb is treated as a separate (vertical) 2-dimensional plane.
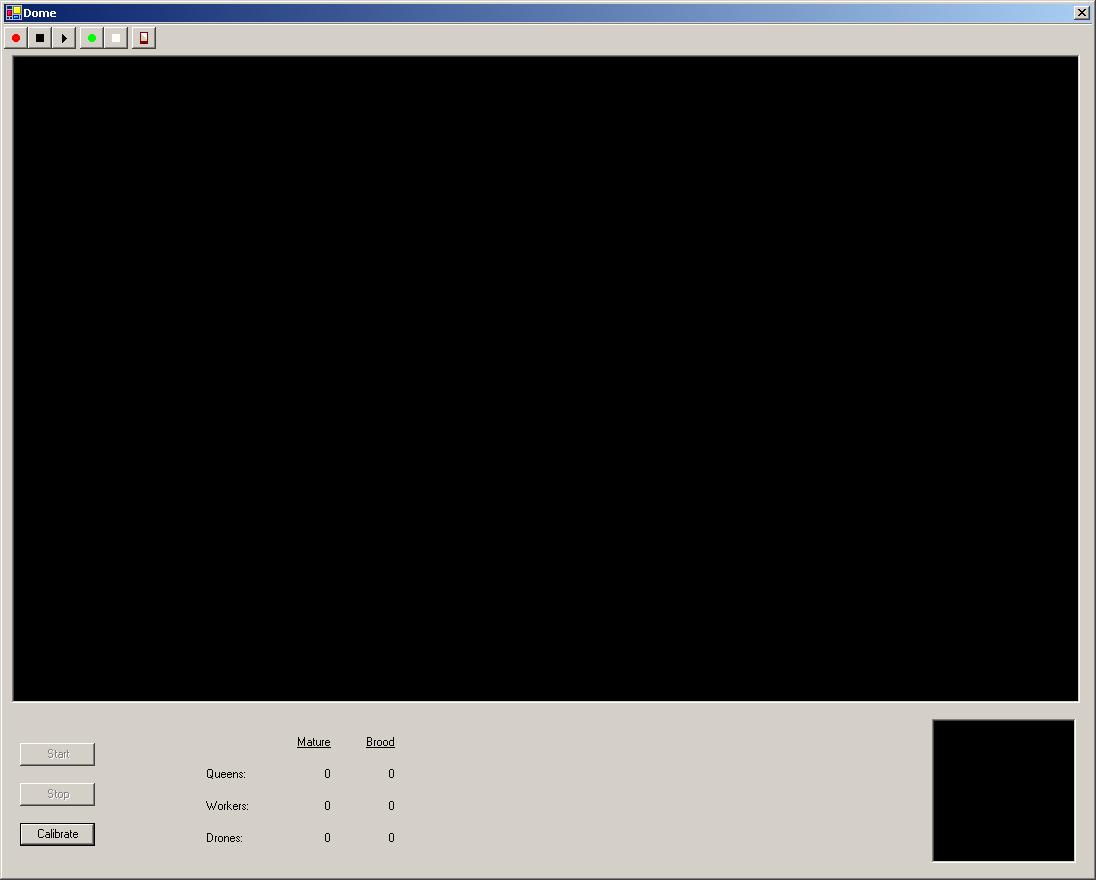
When you run the application, you see a screen like this:
Start by clicking the "Calibrate" button. This will show you the following dialog box:
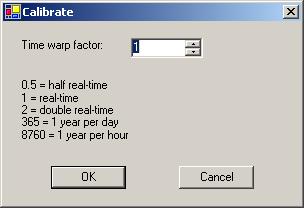
The dialog provides some example values that you can use, or you can enter your own. The only requirement is that you have to enter a positive value. Beyond that, there are no specific limits on what you enter, but you may encounter errors in extreme cases (e.g. if you say that one nanosecond of simulated time should correspond to one year of real time).
After you click "OK", you will see a picture appear in the main screen that flickers for about 5 seconds. At this point, the computer is calculating its maximum speed, by seeing how many ticks it can process per second. It will display a message when it has finished, telling you that calibration is complete. You can now run the simulation, by clicking the "Start" button, and stop it by clicking the "Stop" button when you've seen enough.
Important parts of this screen:
The toolbar is at the top of the screen, and looks like this:
![]()
It contains the following buttons:
![]() Start recording a video
Start recording a video
![]() Stop recording or playing a video
Stop recording or playing a video
![]() Start playing a video that you have recorded
Start playing a video that you have recorded
![]() Switch to dome view
Switch to dome view
![]() Switch to hive view
Switch to hive view
![]() Kill the queen (the icon is supposed to look like a guillotine)
Kill the queen (the icon is supposed to look like a guillotine)
The "dome view" and "hive view" buttons are only effective when running a simulation. When you play back a video, it will show the views that you chose when recording.
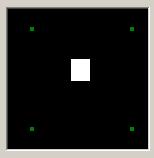
When you are in dome view (the default), the main viewing area looks like this:
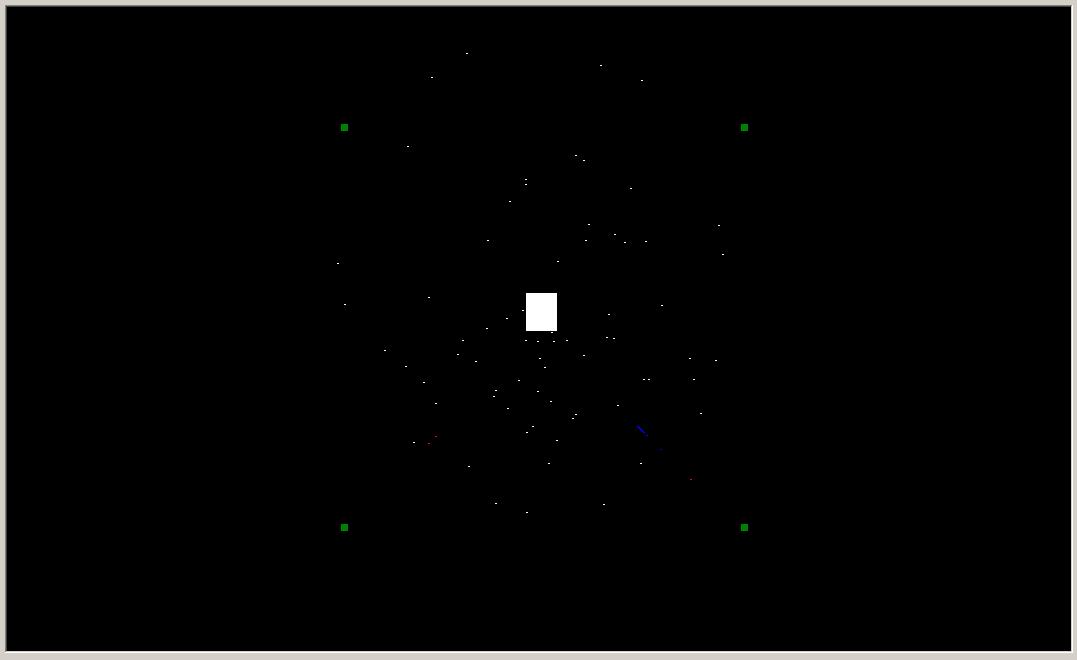
The white rectangle in the middle is the hive. The four green squares around it are feeding stations. In the current scenario, they have the following scores: bottom-left=10, top-left=20, bottom-right=30, top-right=40. For the purposes of selecting between food sources, it is only really the order that matters, rather than the absolute values. So, a feeding station with a higher score should attract more bees to it.
All the dots are worker bees. A white dot is a worker that's searching for a food source. A red dot is a bee that's going directly towards a known food source. A blue dot is a bee that's returning to the hive, either because she's found a food source or because she's wandered too far from the hive and is giving up. After a while, there will be very few white dots left, so you will just see a steady stream of bees between the hive and the feeders, with red dots radiating outwards and blue dots returning. This provides a visual expression of the metaphor that the bees are the lifeblood of the hive, since red (oxygenated) blood travels outwards from the heart, and blue blood returns to it.
In hive view, the main viewing area looks like this:

This displays the surface of the selected comb in the selected hive. In the current simulation, there is only one hive available, and the selected comb defaults to the first one. The hexagons represent cells, which are colour-coded to reflect their contents: red=brood, blue=nectar, green=pollen. You can also see bees in more detail than the dots in dome view. There are three different images, for the different castes:
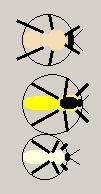
From top to bottom these are drone, queen, and worker. The circles represent the bounding circles - these aren't displayed when the simulation is running, but it demonstrates that a simple collision detection algorithm will be fairly accurate. The different parts of the bees (e.g. head, thorax) are all proportional for a typical bee of each caste, and the bees are in proportion to the frame (a standard 8.5" by 14" size). The cells are a more arbitrary size, rather than corresponding to a real-life size. In reality, there are differently sized cells for different castes.
The smaller square in the bottom-right of the screen displays a map of the dome. This is the same information that you see in the main area when in dome view, except that it's smaller, and there are no bees (just hives/feeders).
In both views of the dome, the objects you see are sized proportionally to each other. However, this doesn't match the scale used for the distances between objects. There are two issues here: scale factor and magnification. The scale factor is used for distances; it is 1 pixel per metre in the main viewing area, and 1 pixel for every 4 metres in the smaller map view. The problem is that a 2cm long bee would be invisible at this scale. On the other hand, if it was drawn at a scale of 1 pixel per cm, you wouldn't be able to see a hive and a feeder on your screen simultaneously; there would be a distance of 20,000 pixels between them.
The map works on a similar principle to an orrery (a mechanical model of our solar system), where the planets would be too small to see if they were sized proportionally to the distances between them. So, a magnification is calculated, as the minimum value required to make the smallest object visible. Using my current screen settings, that works out at 66.7 for the main area, and 40 for the smaller map. It is lower for the smaller area, because there aren't any bees there, so the smallest object is larger.
To clarify, these issues only affect the display, and not the internal workings of the simulation. And by contrast, hive view has a constant scale of 3 pixels per mm, for distances and objects.
In the future, it would be possible to extend the functionality of dome view, so that the main area is a close-up of a selected portion of the dome, as indicated by a rectangle drawn on the smaller map area. This is similar to the way that games like Civilization work. This could either be done at a constant size, or there could be an option to zoom in and out.
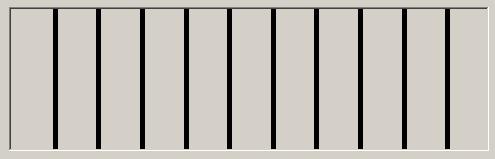
The picture at the middle-bottom of the screen only appears when you are in hive view. This shows a cross section of the hive, with the 10 frames. At present, this is just decorative rather than functional, but it could be extended to allow you to select a comb of interest.
Near the bottom-left corner of the screen, you see some statistics:
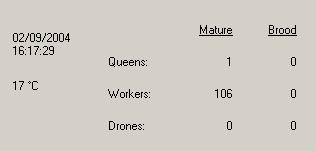
At any given time while the application is running, you can see the total number of bees, both inside the hive and foraging in the dome area. This quantity will be divided up into categories: queens, workers, and drones. Similarly, the number of brood within the hive will be split into the same three categories.
You will see changes as old bees die, and new eggs are laid by the queen. If you kill the queen, then eventually all of the bees will die, at which point you can stop the simulation.
You can also see the current (simulated) date and time, and the temperature in the dome. This temperature is based on average monthly data in London (http://www.worldclimate.com/cgi-bin/data.pl?ref=N51W000+1202+0005305G2), with some arbitrary variation based on the time of day. If it is too cold, then bees will not fly outside. I have currently defined the minimum temperature as 5 degrees Celsius, but this is an arbitrary value which could be changed.
The main part of the simulation is the "game loop". There are two key concepts here: the time-warp factor and the tick rate (i.e. the number of ticks per second). The time-warp factor is specified by the user, as described in the calibration section earlier. The tick rate is then calculated automatically.
The "base rate" is to have 10 ticks per second, when the simulation is operating in real-time. In each tick, every cell and every bee is given a chance to carry out some behaviour. For instance, brood in a cell will get closer to hatching, and a bee might move closer to a food source. If the simulation then gets increased to running twice as fast as real-time, i.e. a time-warp factor of 2, then the ideal response to double the tick rate too, so that there would be 20 ticks per second. The actions performed in each tick would then be basically the same (although there is a non-deterministic aspect to the simulation), so this would be the equivalent of fast-forwarding a video.
However, there is an upper limit on the tick rate, which is constrained by the hardware. The calibration utility will ascertain the maximum tick rate, then see whether timewarp x 10 is feasible. If not, it will assign the maximum rate, and then adjust the behaviour in ticks. There is a related issue of granularity; however fast the computer is, the .NET framework won't support more than 10,000 ticks per second, since it can't accurately track time intervals of less than 100 nanoseconds.
For instance, a bee normally flies at 7 metres per second, which has to be translated into a distance per tick. I calculate this using the formula "distance per tick = distance per second x time warp factor / ticks per second". If the simulation is running in real-time, at 10 ticks per second, that would give 0.7m per tick. Similarly, if the simulation is running at double speed, with 20 ticks per second, that also gives 0.7m per tick.
However, if we ran it at double speed with 10 ticks per second, this would be 1.4m per tick, which means that a foraging bee would have fewer opportunities to change direction while searching for a food source. This means that the results would be different to "fast forwarding" a real-time simulation, since you would get a loss of detail. It would be possible to incorporate some abstraction into the model, e.g. by making a queen lay two eggs in one tick, but this hasn't been done yet. To some extent, that would be a move away from agent based modelling towards mathematical modelling, so I'm not entirely convinced that it would be appropriate.
Bees have a finite lifespan, and they can also starve to death. A bee's age and hunger are incremented in each tick. If a bee dies, then it currently just disappears, and the global quantities are adjusted accordingly. In the longer term, any bee that dies inside a hive should be modelled as a corpse, so that undertaker workers will have to remove it.
The source code uses the concept of delegation (similar to a function pointer), so that it can reuse the outer loop, and perform different actions in the middle: either running a simulation, or playing back a video.
A queen will lay eggs in empty cells. At the moment, she is limited to the comb she's on, but this could be improved in the future. I store a flag with each queen, to show whether she has mated or not. In real-life, it is important for a queen to mate with multiple drones (typically about 15), to achieve genetic diversity within the hive. However, for my purposes I simply need to know whether she is capable of laying female eggs.
In reality, a queen would be herded towards an empty cell by her attendant workers, and she would lay a male or female egg as appropriate, based on the size of the cell. Since all the cells in my simulation are identical (and there are no attendants), I have simply assigned a 50:50 probability of a male or female egg.
At present, there are only two roles defined for workers: scouts and foragers.
If a scout is outside the hive, she is either searching for a food source or returning to one that she has found previously. If she is inside the hive, and hasn't found any food, she will leave to search for some. If she is inside the hive, and has found a food source, she will wait around for a while in case a fellow scout comes back with a better source.
If a forager is outside the hive, she is travelling to a food source that she has been told about. If she is inside the hive, and doesn't know about any food sources, then she will wait for a scout to turn up and notify her of one. If she is inside, and does know about a food source, she will wait around for a while in case a scout turns up with a better source.
Since I haven't implemented guard bee behaviour by workers yet, I can't evict drones in the autumn. Instead, I have programmed them to self-destruct if they are present in autumn or winter. This also applies to any new drones who are born, so you may observe that you see drone brood in the statistics area, but never any mature drones.
There isn't a user interface to configure the start date (it matches your current computer clock), but it is a simple one line change to the source code.
When a scout is searching for a food source, she effectively uses Brownian motion to do this. At any given tick, there is a 50:50 chance that she will either continue in her current direction or choose a new direction at random (a compass bearing from 0-359 degrees).
When a scout gets within 50m of a food source, she can then detect it, and will aim directly towards it.
If a scout travels more than 300m away from the hive, she will return directly to the hive.
This page was last updated on 2004-09-05 by John C. Kirk
![]()
![]()
![]()
![]()